Piper Diagrams are a powerful data visualization tool, that have a variety of useful applications for electric generating facilities with Coal Combustion Residual (CCR) units, including developing Conceptual Site Models (CSM) and supporting alternative source demonstrations (ASD). Learn more about approaches to overcome the recognized limitations of Piper Diagrams and how to make the most of this valuable technique.
Related Services

CCR Rule Groundwater Monitoring Requirements
The Resource Conservation and Recovery Act (RCRA), enacted in 1976, addressed the management of hazardous waste and prescribes the means and methods to monitor hazardous (Subtitle C) and non-hazardous (Subtitle D) waste facilities, particularly landfills and storage sites, to assess potential contamination and protect water resources. The performance of groundwater monitoring under RCRA and subsequent amendments is required to demonstrate that human health and the environment are protected. Groundwater monitoring is an integral component of compliance under RCRA and the EPA’s 2015 Hazardous and Solid Waste Management System: Disposal of Coal Combustion Residuals from Electric Utilities; Final Rule (40 CFR Part 257, the “CCR Rule”) and the proposed Legacy CCR Surface Impoundments rule (proposed rule) to amend the CCR Rule under § 257.94.
Under the CCR Rule, detection monitoring is one of the initial requirements, where a facility must monitor groundwater for statistically significant increases (SSIs) in the concentrations of the seven detection monitoring constituents (the Appendix III) above background concentrations in groundwater monitoring wells at a CCR unit, a legacy impoundment or CCR Management Unit (CCRMU) under the proposed rule. If there is a potential statistically significant increase (SSI), under § 257.94(e)(2), the facility must either initiate an assessment monitoring program under § 297.95 or perform an alternate source demonstration (ASD) to establish whether the potential SSI is due to either another groundwater source or an error in sampling, analysis, statistical evaluation, or natural variation in groundwater quality. The use of the Piper Diagram is a useful line of evidence (either “key” or “supporting”) when used in concert with other lines of evidence.
The Role of the Piper Diagram
The Piper Diagram–a graphical representation that allows geoscientists to analyze and interpret groundwater chemistry data—is a useful line of evidence (either “key” or “supporting”) for evaluating potential releases of CCR constituents when used in concert with other lines of evidence.
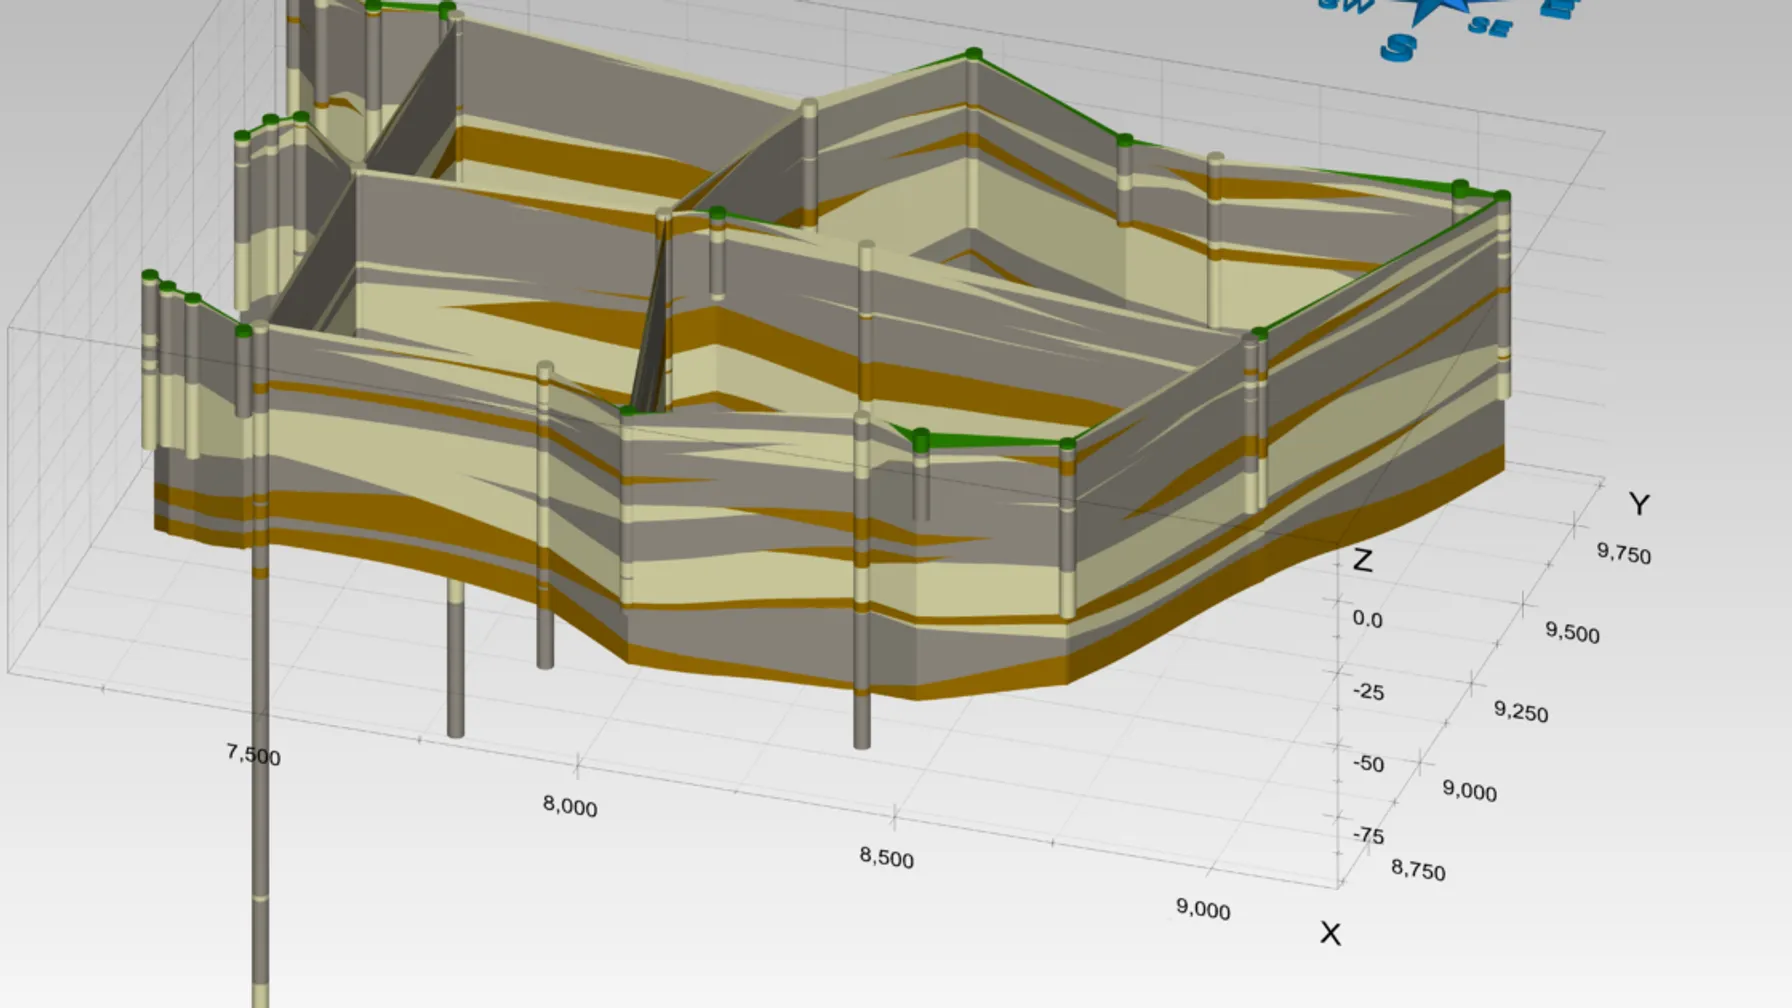
Laying out a framework to organize site characteristic information that helps with understanding fate and transport mechanisms at the early stages of a monitoring program is important to readily evaluate SSIs and alternate sources, if necessary. This involves developing a Conceptual Site Model (CSM), which is a key, base component in a CCR Rule compliance program that serves as a foundation for further investigation, analysis and decision-making that may arise throughout the groundwater monitoring program. Piper Diagrams are an invaluable tool in constructing the CSM by examining the chemical composition and variations in water samples and have historically been widely used by hydrogeologists and geochemists to analyze mixing of groundwater plumes.

Limitations and New Approaches
Although Piper Diagrams are very useful, they are subject to limitations. As with any visualization tool, the Piper Diagram presents data in very specific ways which, if not performed properly, can lead to misapplication and misinterpretation of the visual presentation. In addition to simplified representation, other limitations include the use of ratios rather than concentrations; limited modeling of geochemical processes; data clustering; similarities in iconic concentrations from different sources; and data set considerations.
Piper Diagrams are a powerful data visualization tool, but with recognized limitations, that are useful for a variety of applications for electric generating facility with CCR units, including developing CSMs and supporting ASDs. Fortunately, these limitations can often be successfully addressed through the use of additional focused data assessments and geochemical modeling. While Piper Diagrams are not necessarily a stand-alone line of reasoning for a successful ASD, they are a viable technique to evaluate and visualize data in combination with additional lines of evidence demonstrating an alternate source. To further explore the utility and relevance of using Piper Diagrams as a line of reasoning for evaluating potential releases of CCR constituents from CCR units, and to learn more about suggested approaches to overcome these recognized limitations, download our White Paper below or contact us to discuss your specific needs.
Understanding Piper Diagrams: Applications and Limitations with Coal Combustion Residuals
